
Tracking and reporting on social media data is no longer just a “nice-to-have”—it’s essential for proving ROI, optimising content, and making better marketing decisions.
In this guide, you’ll learn how to collect, analyse, and report on social media metrics across platforms, plus how tools like Sendible’s social media reporting hub can simplify the process with real-time dashboards, automated reports, and client-ready insights.

What social media data should you collect
To showcase the impact of your social media strategies and ensure alignment with your clients and internal stakeholders in 2025, it's crucial to focus on specific data points that highlight ROI and overall success.
Here's a breakdown of the key social media data you should pay attention to:
- Conversion metrics
- Engagement metrics
- Reach and Impressions
- Brand sentiment and customer feedback
- Influencer performance
- Competitive analysis
- Customised metrics
| Metric type | Best for | Key platforms | Sample metrics |
|---|---|---|---|
| Engagement | Measuring content performance | Instagram, Facebook, TikTok | Likes, comments, saves |
| Reach & Impressions | Brand visibility | Facebook, X, LinkedIn | Reach, impressions, shares |
| ROI Metrics | Proving value | All platforms + GA | Conversions, CPA, ROAS |
| Sentiment | Brand reputation | X, Instagram, LinkedIn | Positive/neutral/negative mentions |
| Influencer Metrics | Campaign tracking | Instagram, YouTube, TikTok | CTRs, engagement, reach |
Conversion metrics

- Track conversions driven by social media channels, including lead generation, website visits, and purchases.
- Measure the conversion rate, cost per acquisition (CPA), and return on ad spend (ROAS) to demonstrate the effectiveness of your social media platforms campaigns. This is the best way to prove ROI from your social media efforts.
What is ROI?
How to calculate social media ROI:
To calculate social media ROI, use the formula:

- Gain from social media efforts: Revenue or measurable results like leads, sales, or customer retention attributable to social media.
- Cost of social media efforts: Total investment, including ad spend, tools, salaries, and other resources.
Why social media ROI matters:
- Demonstrates value: Proves how social media contributes to business goals like revenue growth or brand awareness.
- Guides strategy: Helps allocate resources effectively by identifying the most impactful campaigns or platforms.
- Informs decisions: Justifies investments and tweaks future strategies to improve results.
Key metrics to measure social media ROI:
Depending on your goals, ROI may include metrics like:
- Revenue generated through sales from social media campaigns.
- Leads captured via social media forms or landing pages.
- Customer retention and loyalty driven by engagement.
- Cost-per-acquisition (CPA) or return on ad spend (ROAS) for paid campaigns.
Engagement metrics

- Monitor engagement metrics such as likes, shares, comments, and retweets to gauge social media users' interactions and content resonance.
- Compare engagement metrics across different platforms and content types to understand what resonates best with your target audience.
Social media users analyses: reach and impressions
- Determine the reach by analysing the number of unique users who saw your content, and track impressions to see how many times it was displayed.
- Evaluate the effectiveness of your content distribution strategies and identify opportunities for expanding your reach.
Brand sentiment and customer feedback
- Monitor sentiment analysis to gauge how your brand is perceived by analysing positive, negative, and neutral mentions.
- Respond to customer feedback promptly and address any issues or concerns to foster positive brand sentiment.

How to Turn Customer Feedback Into Amazing Social Media Posts for Your Clients
Influencer performance
- If utilising influencer marketing, measure the impact of influencer collaborations on brand reach, engagement, and conversions.
- Track key performance indicators (KPIs) specific to influencer campaigns, such as click-through rates (CTRs) and conversions attributed to influencers.
Competitive analysis
- Compare metrics like follower growth, engagement rates, and share of voice to gain insights into your competitive landscape.
- Identify areas where you excel or lag behind competitors, enabling you to refine your strategies accordingly.
Customised metrics
- Define custom metrics aligned with your clients' needs and internal KPIs, focusing on outcomes that directly impact their bottom line. You can do this by using social media analytics tools that send over automated reports to your clients.
- Report on these metrics regularly and highlight how your strategies contribute to achieving their desired outcomes.

How to track social media growth?
To effectively measure results and track growth on social media, it's essential to establish a clear framework.
Here's how you can track growth in a meaningful way:
Step 1: Determine the timeframe
Choose the timeframe that aligns with your goals and objectives.
Consider options such as weekly, monthly, quarterly, annually, or even individual campaign durations.
If you're focused on short-term growth, opt for weekly or monthly comparisons. For long-term social media analysis, assess year-on-year growth.

Step 2: Define Key Performance Indicators (KPIs)
Clearly identify the KPIs that align with your business goals.
These should be specific, measurable, and relevant to your social media channels and strategy.
Step 3: Gather relevant social media data
Collect social media data from social media analytics tools, platform insights, and third-party social media management tools like Sendible that provide comprehensive social media data for tracking your KPIs, which will, in turn, help you better understand the social media users that engage with your content.
To save time and improve your reporting, consider grouping your social media posts under campaigns, as Sendible enables you to track their results.
Step 4: Report and analyse results
- Prepare regular reports to communicate your findings effectively.
- Analyse the social media data to identify trends, patterns, and correlations between your social media efforts and the achieved results.
- Look for actionable insights that can guide future strategies and optimisations.

How to gather and report back on social media data?
Once you're clear on what you want to measure, you'll need to start collecting the social media data and producing your reports.
In this section, you'll learn how to gather and report on data from native social networks, Google Analytics, or do all of this from Sendible's reporting hub.
Insights available natively on social media platforms
Each social media platform provides insights and analytics to help you understand how your brand is performing.
Let's take a look at some of the metrics available on each social media channel.
Facebook Insights

Facebook Insights provides a wealth of data to help you understand the social media users that make up your audience.
Engagement is broken down into several sections.
You can find plenty of information on your reach, engagement metrics (likes, comments, shares and clicks), as well as social media metrics on how your posts are performing in general.
This really helps you understand how your social media performance is going.
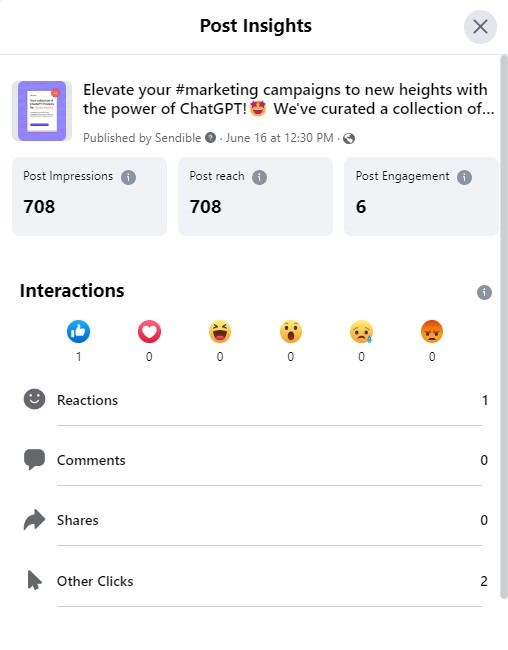
Overview
The Overview section provides a 28-day snapshot of your Page’s performance:
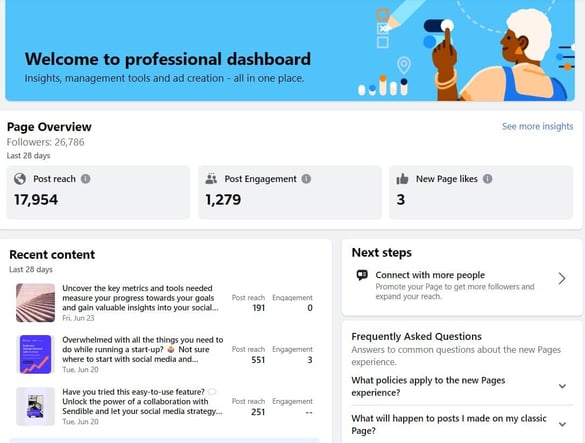
- Post Reach - The number of people who saw any of your posts at least once. Reach is different from impressions, which may include multiple views of your posts by the same people. This metric is estimated.
- Post Engagement - The number of reactions, comments, shares and clicks on your posts.
- New Page likes - The number of new likes of your Facebook Page.
- Recent content - Recently published content such as Facebook stories or posts with a quick overview of the reach and engagement.
Home
On the left sidebar, navigate to Home to get a bit more detailed Page overview for the last 28 days.
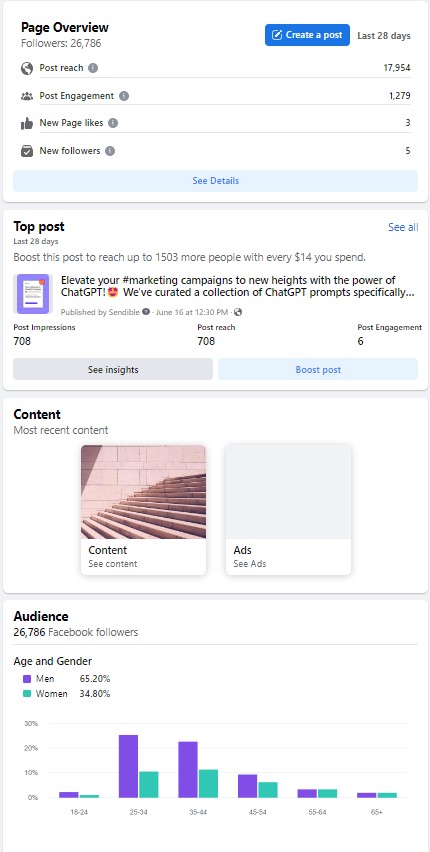
Here you'll find important metrics such as the total number of followers, post reach, post engagement, new page likes, and new page followers.
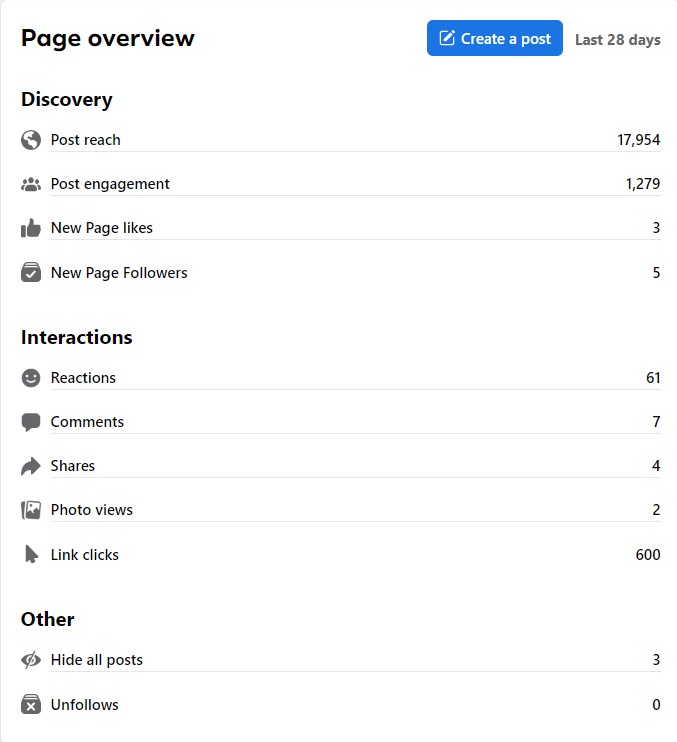
Page Overview
Just under the Home tab, you'll see the Page Overview. Navigate to this section to get a neat overview of the most important data collected for the past 28 days.
Content
Under the Content section, you'll be able to get a good grasp of your content performance.
You can choose the timeframe (last 7, 28, 60, or 90 days) as well as the order of posts by date, reach, or engagement.
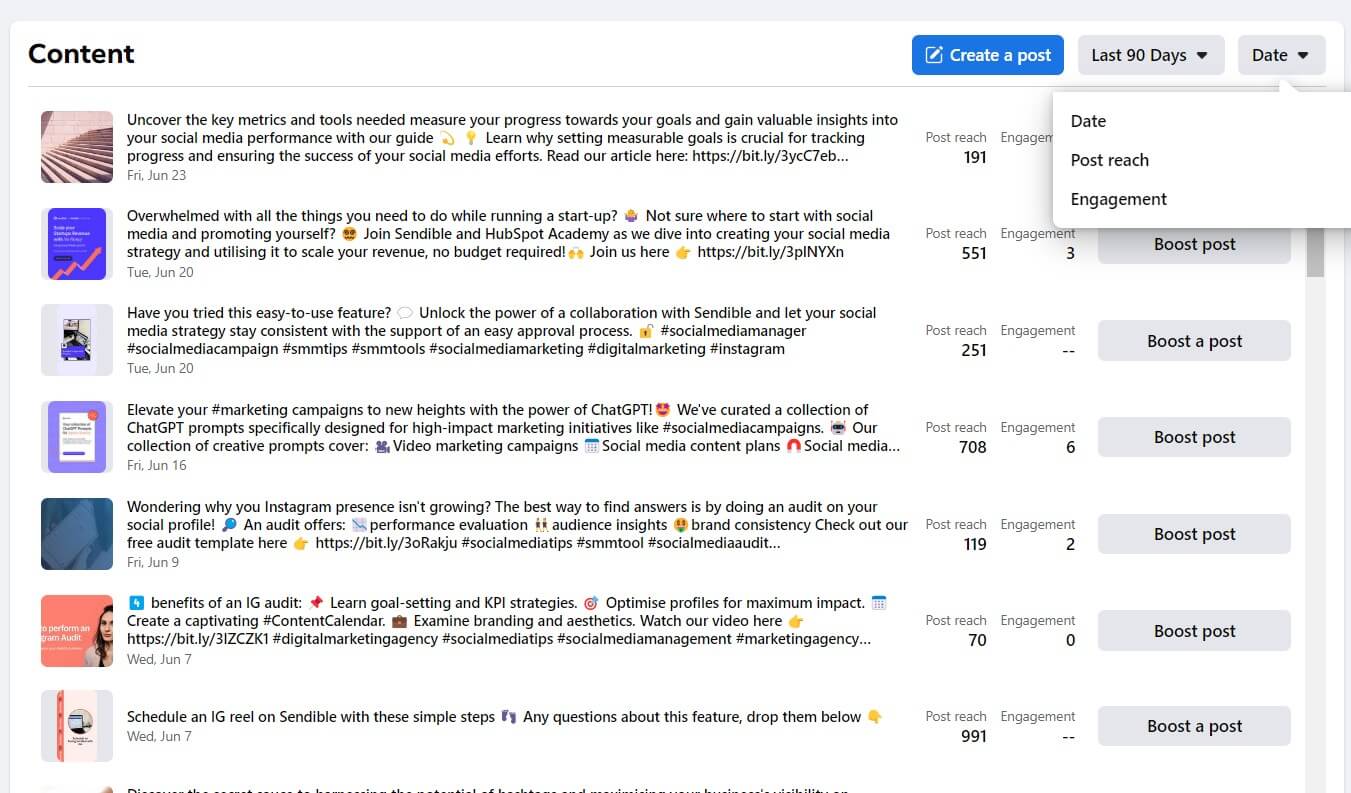
For a more detailed analysis, just click on a post from the list to learn more about the specific metric you're interested in.
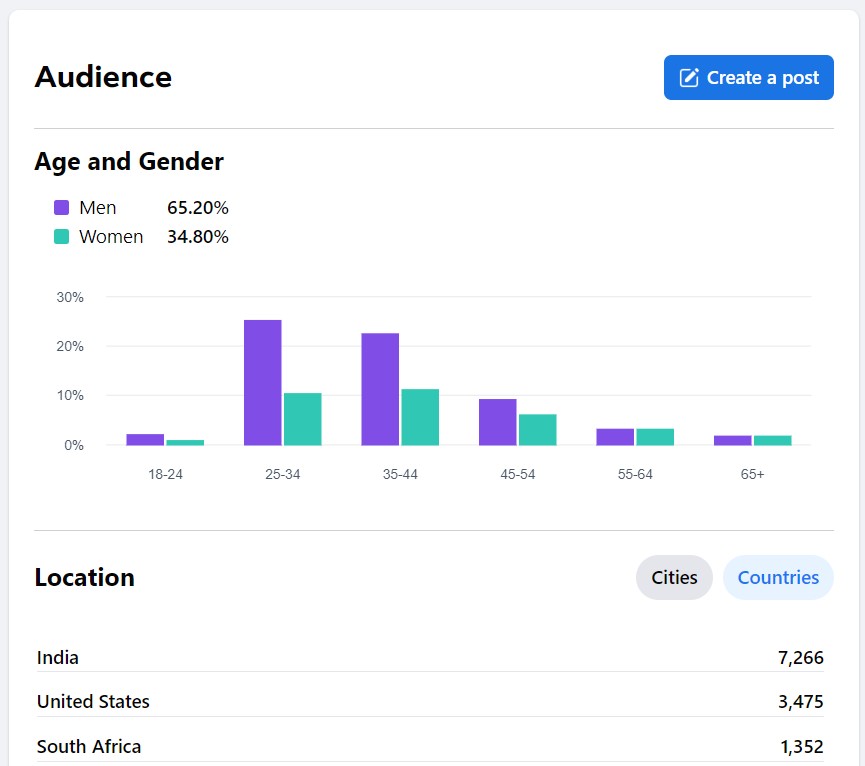
Audience
Finally, navigate to Audience to learn more about the demographics of your followers.
What are the most important Facebook metrics to track?
Of course, the answer to the question of what Facebook metrics to track will vary depending on your or your client's specific business objectives and metrics. However, in general, these are the metrics that tend to be most important:
- Reach and impressions: Measure the number of unique users who saw your content and the total number of views.
- Engagement metrics: Track likes, comments, shares, and clicks to understand how users are interacting with your content.
- Audience demographics: Gain insights into the demographics and interests of your followers.
Instagram Insights

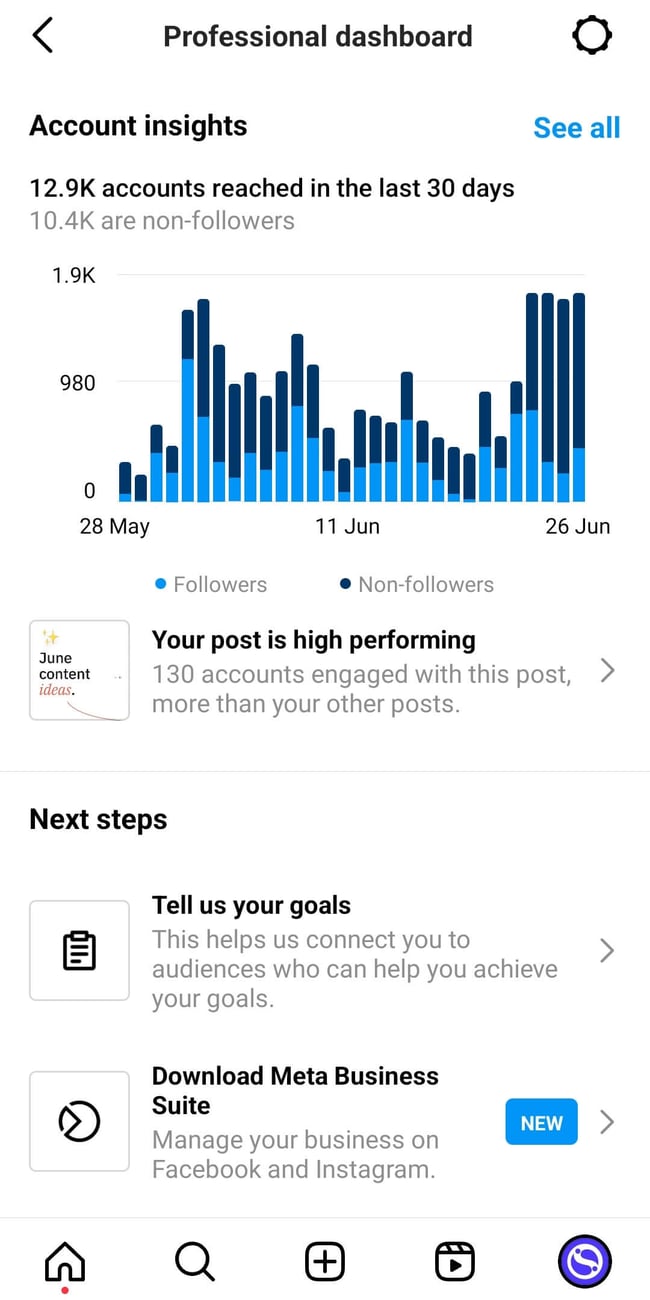
You can navigate to Instagram Insights either directly from your profile by tapping on the Professional Dashboard or by tapping on the hamburger menu at the top right and then tapping on the Insights option.
Account insights
The first thing you'll come across is the Account Insights section, which provides a comprehensive overview of the accounts that have been reached in the last 30 days, followed by a sneak peek of your top-performing post.
Overview
To gain a better understanding of your content pillar strategy, you can expand the analytics by selecting a timeframe from the drop-down menu on the top left.
Then, you'll be able to see the number of Posts, Stories, and Reels you shared for the chosen period. It's easy to navigate each content type and dive deeper into the insights.
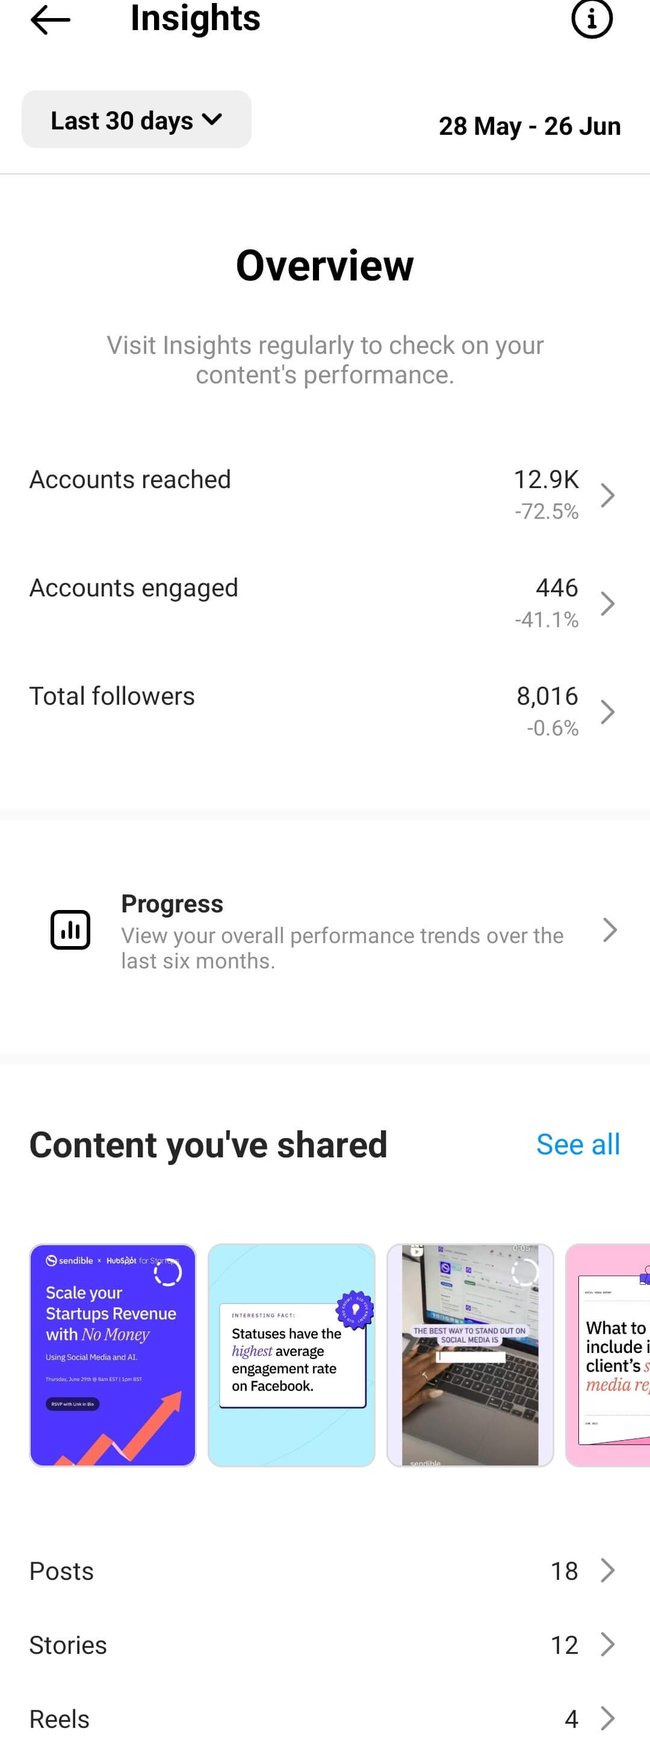
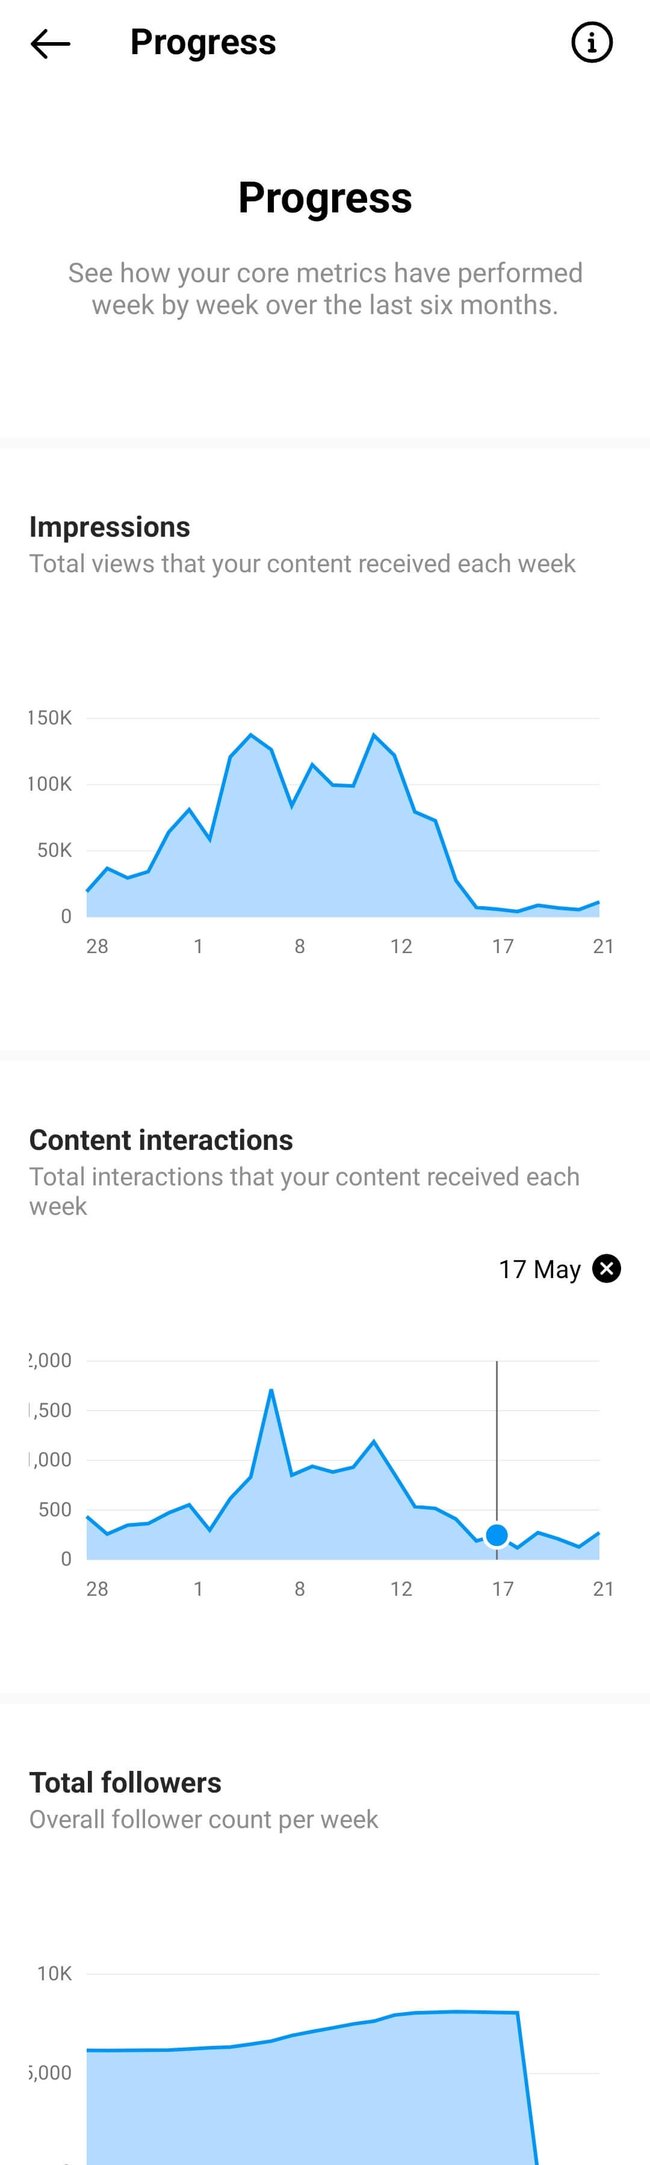
Progress
Check out your overall performance trends for the past six months by clicking on the Progress tab located just below the overview section.
Content
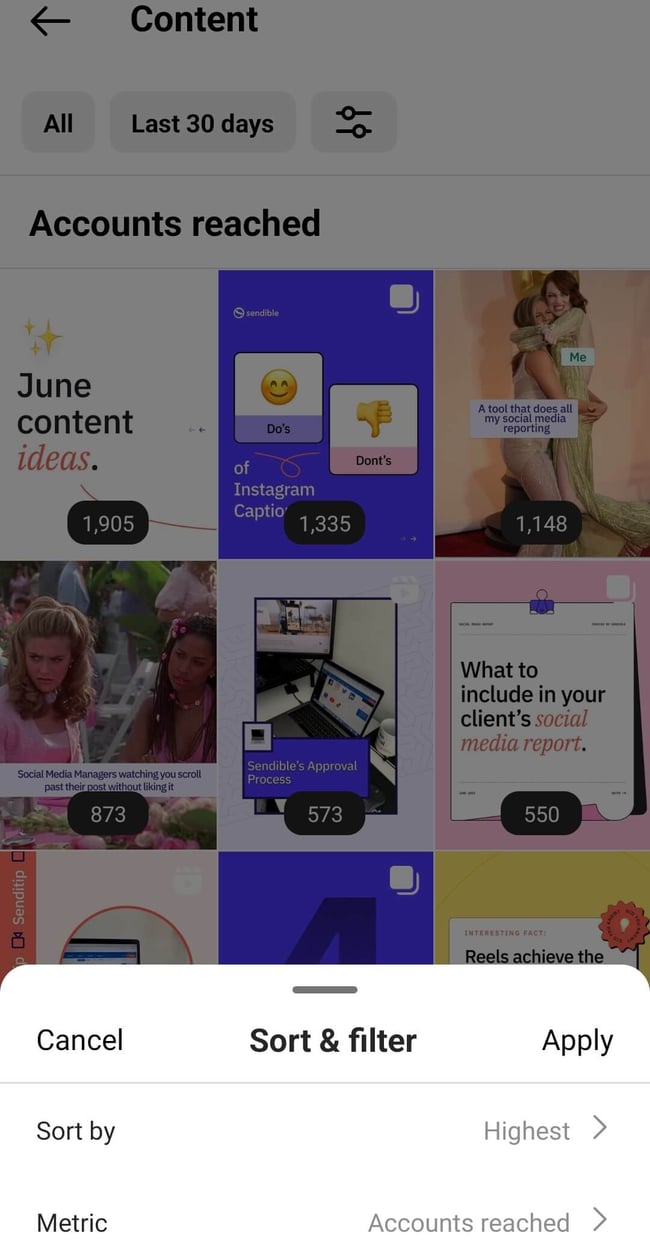
Click on the See all just next to the Content you've shared section to gain more insights.
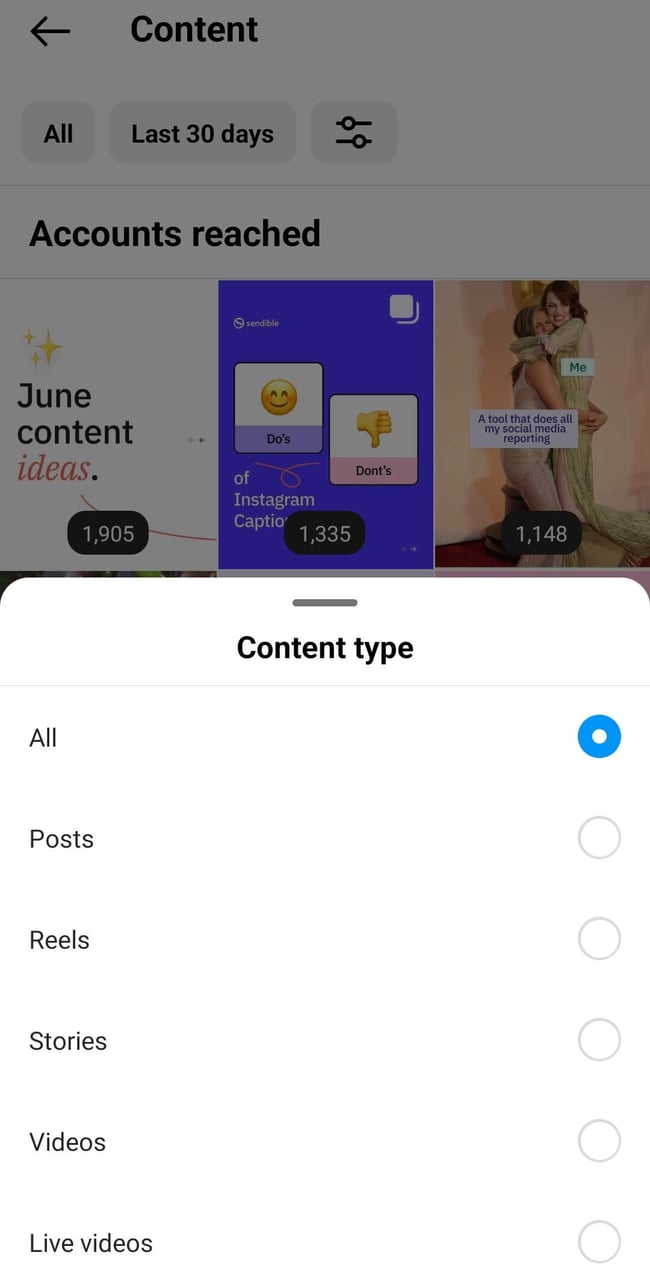
From here, you have the option to view all of your content or filter by specific post types. You can also sort your content by engagement level and choose your preferred metric, either Accounts Engaged or Accounts Reached.
What are the most important Instagram metrics to track?
Determining the most important Instagram metrics to track is a million-dollar question that depends entirely on your pre-set KPIs. However, here are some of the most popular metrics to keep an eye on:
- Reach and impressions: Monitor the number of unique global social media users that have viewed your posts and the total number of views.
- Engagement metrics: Analyse likes, comments, and saves to gauge audience interaction and interest.
- Story metrics: Assess views, taps forward/backward, and exits to evaluate the performance of your Instagram Stories.
- Link Clicks: The number of times users have clicked on the link in your bio or swipe-up links in your Instagram Stories.
X (Twitter) Analytics

To access X (Twitter) Analytics, simply navigate to the left sidebar and click on More. Then, select Creator Studio from the drop-down menu and choose Analytics.
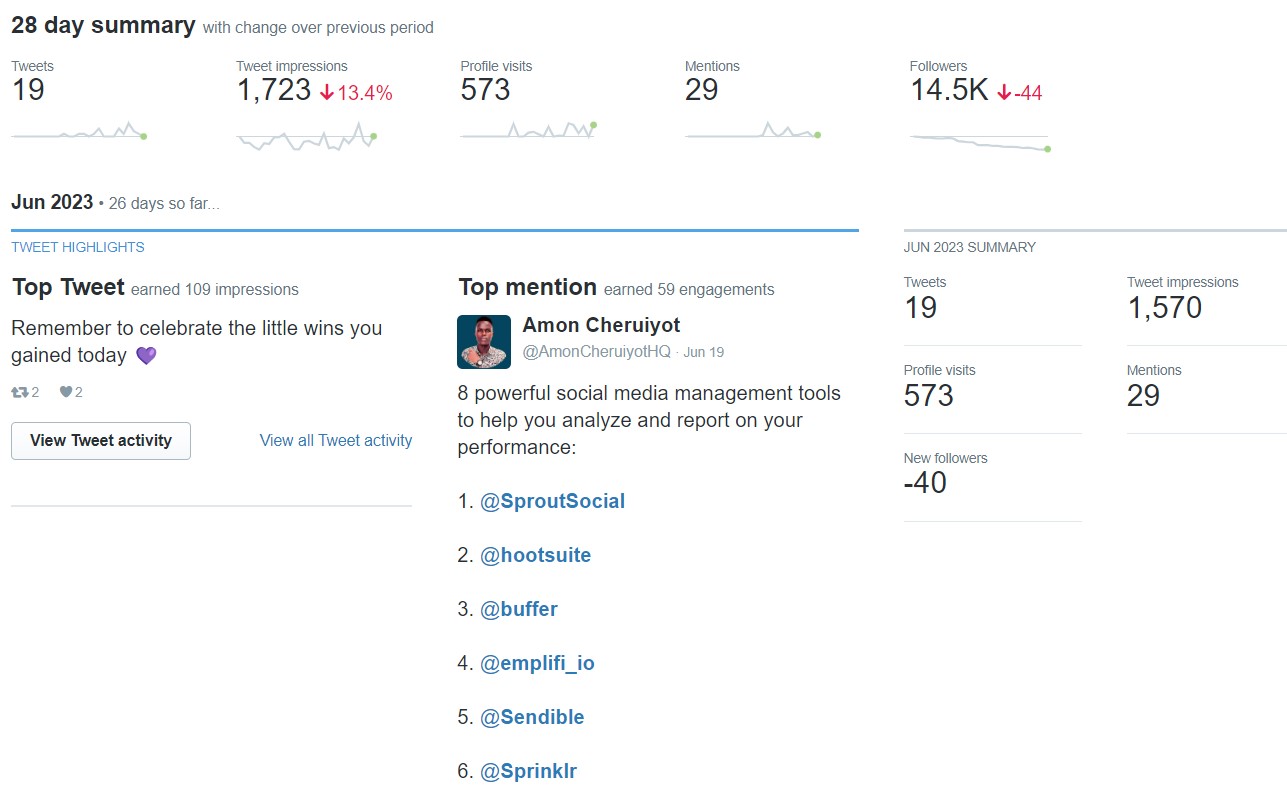
Overview
This 28-day dashboard provides an overview of your top-performing Tweets and introduces you to the influencers in your network. It showcases high-level statistics and acts as a gallery of your most successful content.
Tweet Activity
To access your tweet insights, head to the Tweets section on the top menu or click on View all Tweet activity under the Top Tweet section in the Overview.
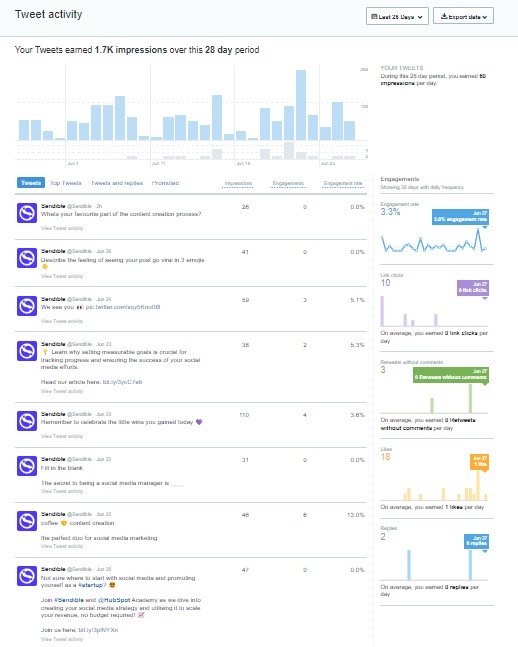
You'll have all the details on how many people have viewed, Retweeted, liked, and replied to your Tweets. Plus, you can filter by Promoted-only Tweets, adjust the date range, and export the data as a .CSV file.
More
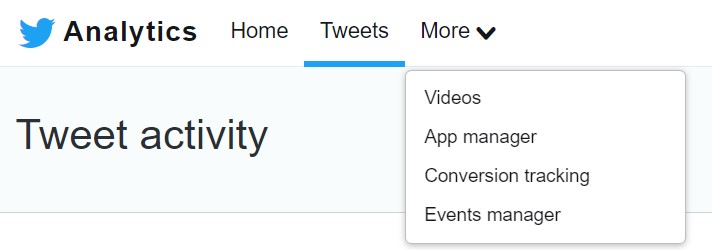
From the More drop-down menu located at the top bar, you can dive even deeper into data:
- Video Activity Dashboard (VAD): The video activity dashboard provides you with valuable insights on retention, view rate, and completion rate for all of your X (Twitter) videos. You can even filter by promoted views and export the data as a .CSV file, while adjusting the date range to suit your needs.
- Conversion tracking: Take your X (Twitter) advertising to the next level by setting up conversion tracking. This tool allows you to measure the actions your audience takes after viewing or engaging with your ads, giving you valuable insights into their customer journey. Don't miss out on this opportunity to optimise your return on ad spend.
What are the most important X (Twitter) metrics to track?
It's important to note that the choice of metrics to track depends on your specific social media objectives and KPIs.
- Engagements: The total number of interactions with your tweets, including likes, retweets, replies, and clicks.
- Reach: The total number of unique users who have seen your tweets.
- Retweets: The number of times users have retweeted your tweets, amplifying your content to a wider audience.
- Hashtag Performance: Track the performance of specific hashtags used in your tweets, including impressions, engagements, and reach.
- Video Retention: Analyse how long viewers are watching your videos and identify any drop-off points.
LinkedIn Analytics

To get to LinkedIn Analytics, head over to your LinkedIn Page and click on the "Analytics" tab located at the top of the page. This will give you access to valuable insights on how your LinkedIn Page and its content are performing.
Once you're in, you can choose from a variety of overviews from the drop-down menu, including:
- Visitors
- Followers
- Leads
- Content
- Competitors
- Employee Advocacy
Visitors
Before diving into the data, choose the desired timeframe.
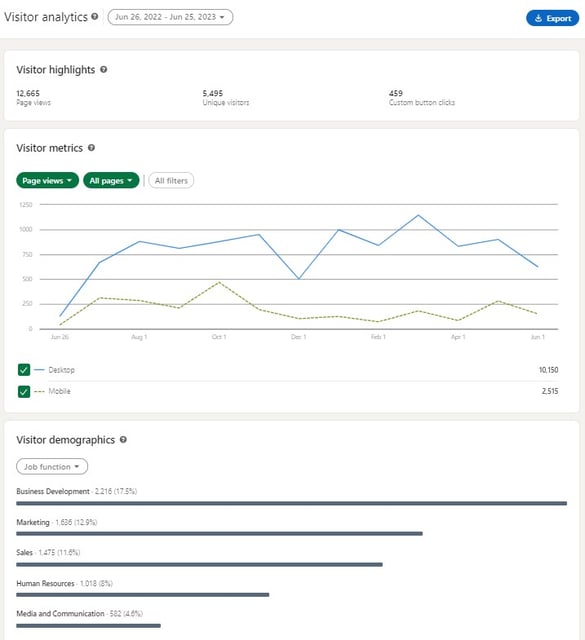
- Visitor highlights: This section provides valuable insights on the total number of page views and unique visitors over time, measured across both desktop and mobile for logged-in LinkedIn members. The number of unique visitors is calculated daily and not de-duplicated over multiple days.
- Visitor metrics: This section offers helpful information on the number of unique visitors and page views over time, including those from LinkedIn's native apps and mobile web browsers. The number of unique visitors is calculated daily and not duplicated over several days, giving you a clear understanding of your page's performance.
- Visitor demographics: You can discover more about the types of LinkedIn members who visit your page, including their job function, company size, industry, location, and seniority. This data is aggregated and segmented for your convenience.
Followers
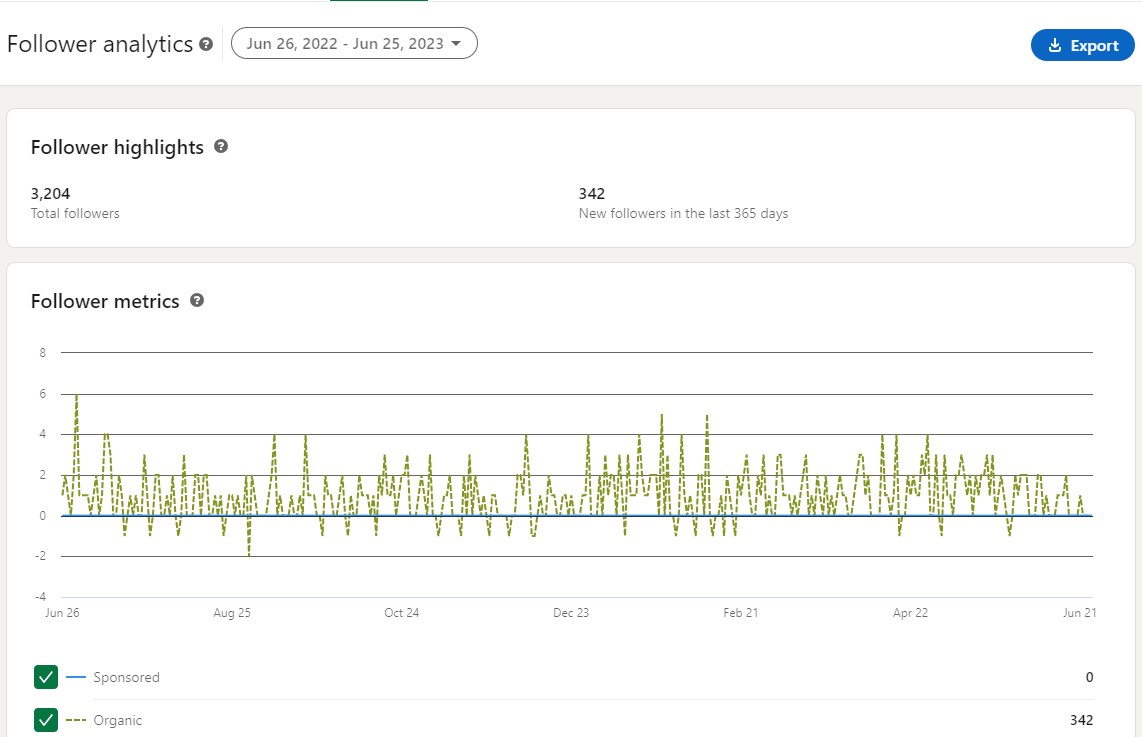
- Follower highlights: You can keep track of your all-time followers as well as any new followers your LinkedIn page gains in the last 365 days.
- Follower metrics: The number of fresh followers, including those acquired through Ads and Sponsored Content, are displayed in the Follower metrics section.
- Follower demographics: Here you can find a breakdown of the different demographic groups among your LinkedIn page followers. The percentage shown represents the proportion of followers within each demographic out of the total number of followers with standardised demographics.
- All followers: Here, you'll find the list of your page's current followers, sorted by recency.
Leads
Keep in mind that leads collected from your Page Home and Product pages are only available for 90 days after submission.
Content
Keep track of how your organic and sponsored posts are performing over time with engagement metrics.
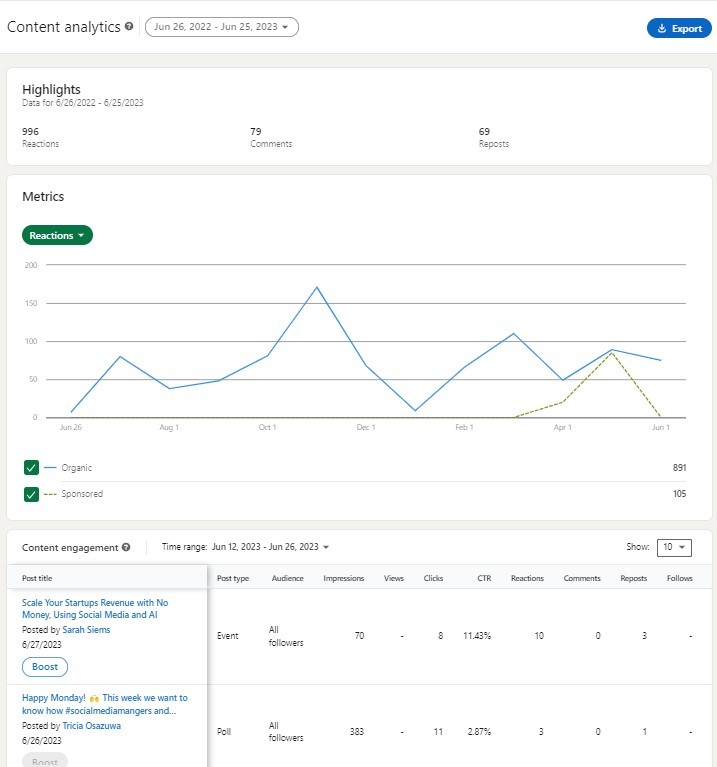
- Metrics: You have the option to select which metric you want to explore in the Metrics section.
- Impressions
- Unique impressions
- Clicks
- Reactions
- Comments
- Reposts
- Engagement Rate
- Content engagement: For individual posts, engagement metrics are updated in real-time, and data for sponsored posts includes both organic and sponsored engagement. The time range filter applies to the dates when your posts were created, and all dates and times are in UTC. However, please note that video views are limited to the past six months.
Competitor analytics
Head to this section to see how your LinkedIn Page's follower and content metrics stack up against those of other Pages on the platform. Note that the time range filter doesn't affect the total number of followers or the top-performing competitor posts.
Here you'll see the comparison of follower metrics, as well as organic content metrics.
Employee Advocacy
Are you running an employee advocacy program? Amazing! This section provides valuable insights into how your employees are posting recommendations and how LinkedIn members are engaging with those posts.
What are the most important LinkedIn metrics to track?
Remember, the specific metrics you track will depend on your business objectives and the actions you want your LinkedIn Page to drive. By regularly monitoring metrics listed below, you can assess the effectiveness of your LinkedIn marketing strategy, make data-driven optimizations, and demonstrate the ROI of your LinkedIn efforts:
-
Conversions: Monitor the number of conversions resulting from your LinkedIn Page, such as form submissions, lead generation, or website purchases. This metric helps you gauge the direct impact of your LinkedIn efforts on driving valuable actions.
-
Click-through Rate (CTR): Track the percentage of clicks on your LinkedIn Page's posts or ads compared to the number of impressions. CTR indicates the effectiveness of your content in capturing audience interest and driving traffic to your desired destinations.
-
Engagement Rate: Measure the level of engagement on your LinkedIn Page, including likes, comments, and shares, as a percentage of impressions. A higher engagement rate signifies that your content is resonating with your audience and generating interest.
-
Lead Generation: Assess the number of leads generated through LinkedIn, such as form submissions, newsletter sign-ups, or contact requests. This metric helps evaluate the quality and effectiveness of your LinkedIn Page in generating actionable leads.
-
Content Performance: Evaluate the performance of your individual posts and content. Track metrics such as impressions, clicks, engagement, and conversion rates specific to each piece of content to identify what types of posts are most effective in driving ROI.
TikTok Analytics

TikTok Analytics is a powerful tool that provides insights into the performance of your TikTok content, allowing you to optimise your strategy for maximum engagement and growth.
Overview
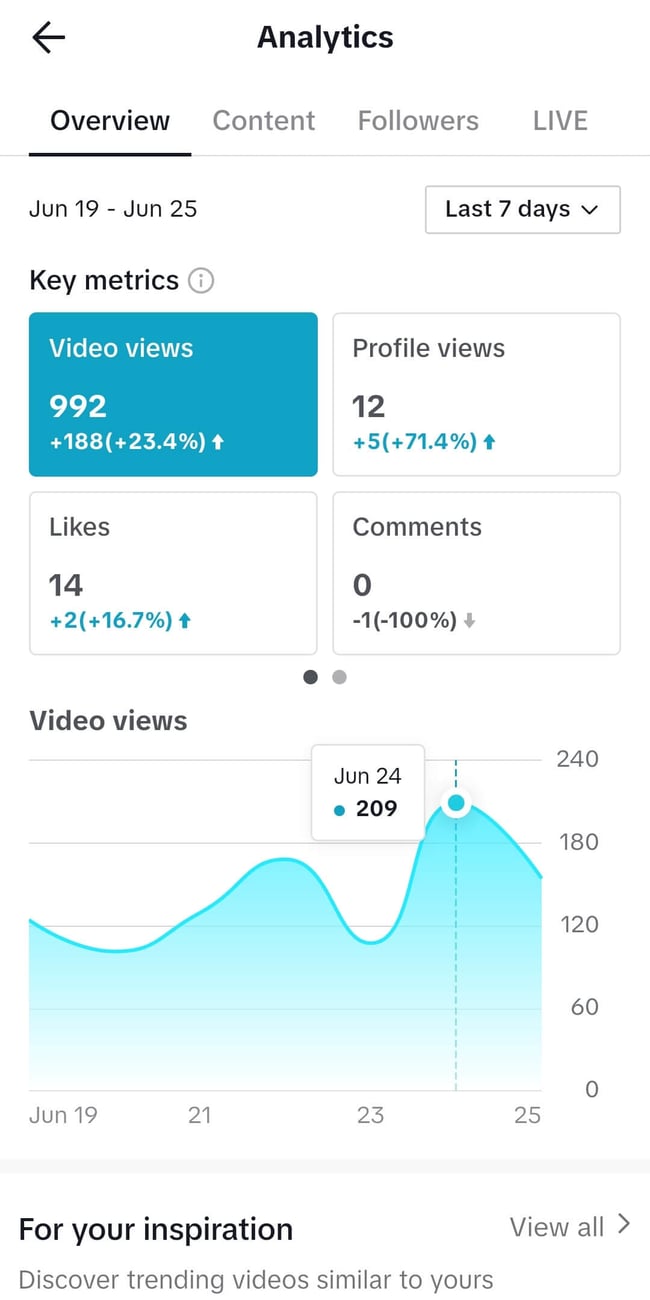
- Follower Growth: Keep track of the growth of your follower base over the last 7, 28, or 60 days, or a custom date range of up to 60 days.
- Video Views: Monitor the total number of views your videos received in the selected date range.
- Likes, Comments, and Shares: Measure the number of likes, comments, and shares your videos received within the selected date range.
Content
- Total Views: Get insights into the total number of views for each video you've posted.
- Total Likes, Comments, and Shares: See the cumulative number of likes, comments, and shares for each video.
- Average Watch Time: Measure the average duration internet users watch your videos.
- Traffic Source Type: Identify where viewers found your videos, including your profile, the For You feed, and more.
Followers
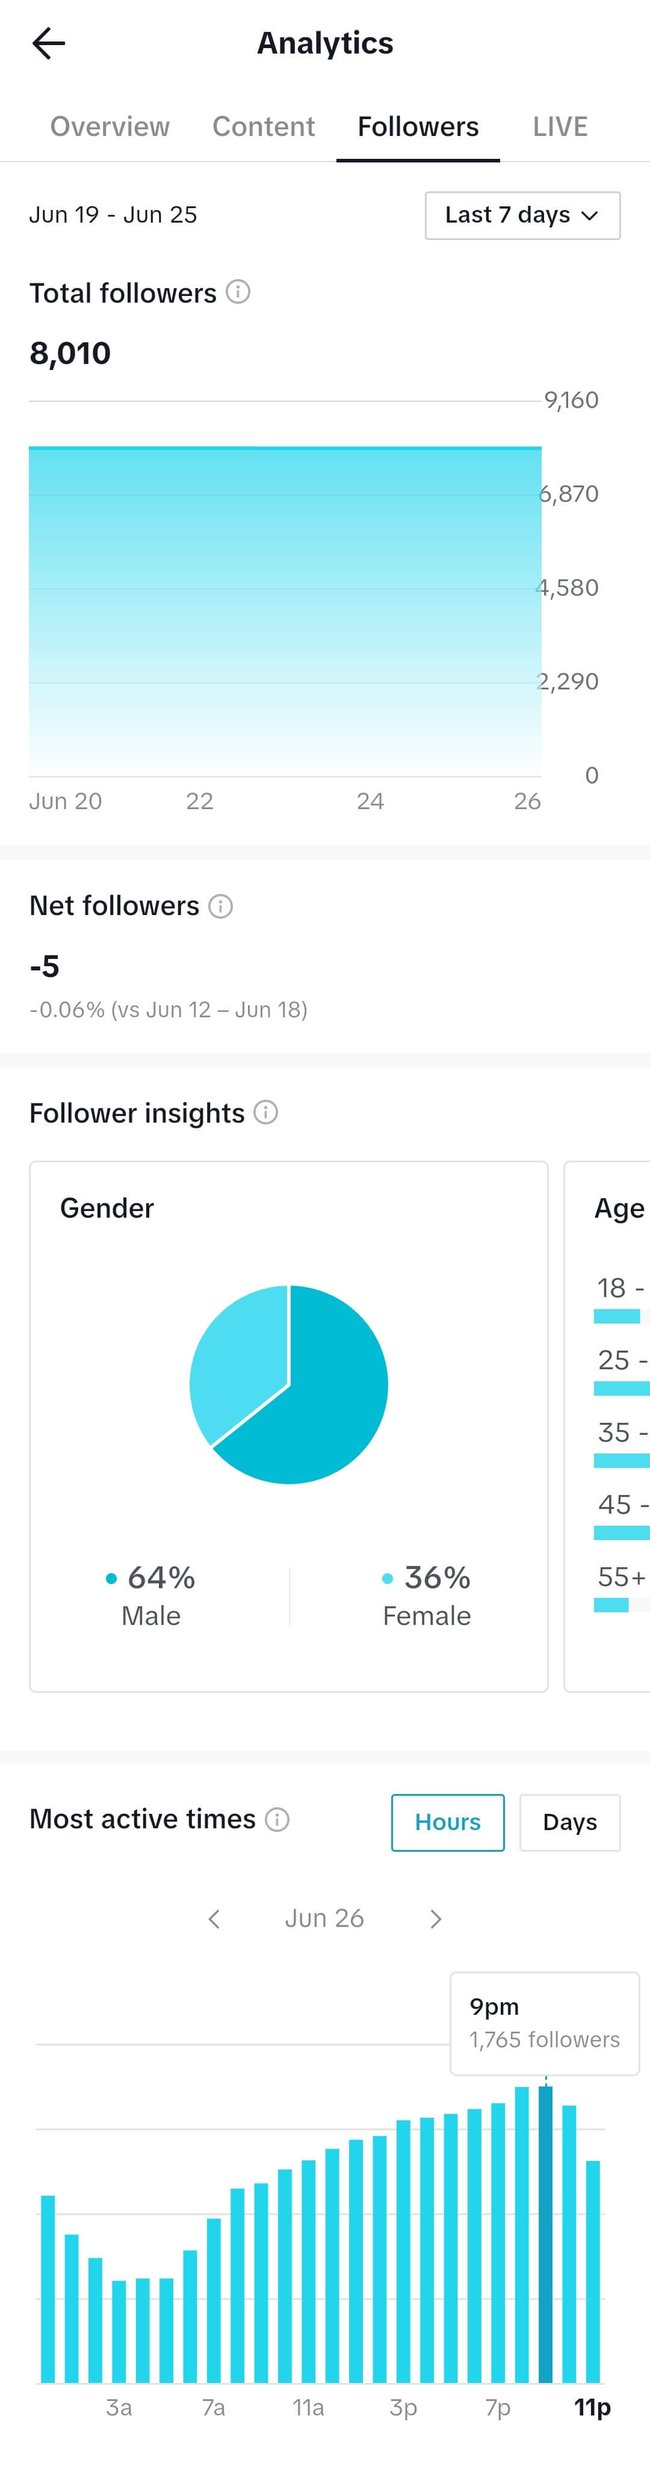
- Audience Demographics: Understand where your TikTok followers are from, their age, and gender.
- Active Times: Discover the times of the day or week when your followers are most active on TikTok.
- Follower Growth Change: Compare the change in follower growth with the previous period.
LIVE (for creators with LIVE access):
- Total Views: Keep an eye on the total number of views on your live streams.
- New Followers: Track the number of new followers gained during your live streams.
- Total Time: Measure the total duration of your live streams.
We know managing TikTok can be challenging, so we've created this handy TikTok management checklist! You can also take a look at our list of ways to promote your business on TikTok.

Capturing social media data in Google Analytics
Google Analytics allows you to extend your data capture by tracking your website activity. For instance, you can see from which networks your visitors came, how long they stayed on your site, check which content they downloaded, and much more.
Let's take a look at a few metrics you could track.
Review all traffic to your website
Looking at all the traffic coming to your website allows you to compare social media with other channels and their performance. Access this area by logging into your Google Analytics account and navigating to Acquisition > All Traffic > Channels:
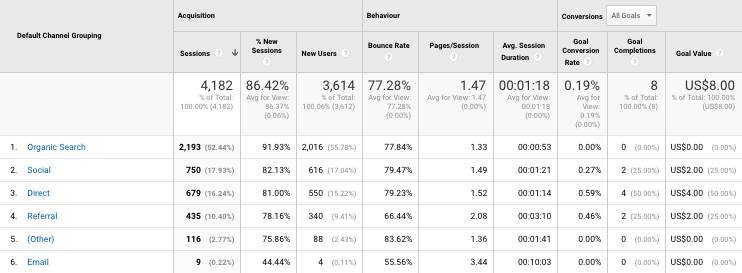
Acquisition:
- Sessions - The number of times when users are active on your site.
- New sessions - The number of new users compared to returning users.
- New users - The number of users coming to your site for the first time.
Behaviour:
- Bounce Rate - The percentage of users leaving your site after a single page view.
- Pages / Session - The average number of pages a user views each session.
- Average Session Duration - The average time users spend on your site per visit.
Conversions:
- Goal Conversion Rate - The percentage of conversions per channel.
- Goal Completions - The total number of conversions.
- Goal Value - The value of each conversion.
(More on Conversions and Goals below...)
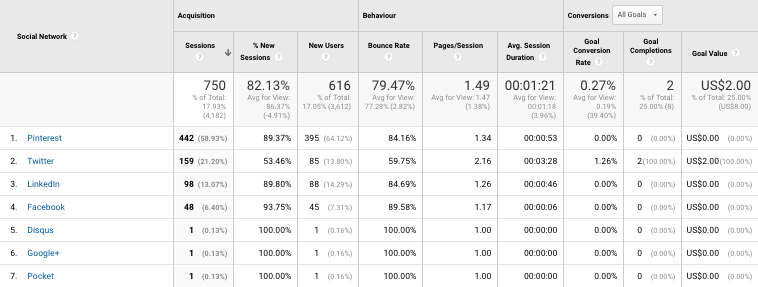
Compare traffic from social media by network
The above metrics are all valid starting places for tracking overall website activity. But with Google Analytics, you can drill down further to get specific social media reports.
For example, you could click 'Social' from the available 'Channels' to display the social media data for each network:
Or, to save you time and help visualise the data, you could create a custom dashboard showing:
- Social Traffic Sessions
- Social Traffic Time on Site
- Social Traffic Pages per Visit
- Social Traffic Popular Content
- Social Traffic Campaigns and Conversions
- Social Traffic by Network
- Social Traffic Conversions by Network
Pro Tip: Here’s a guide to proving social media ROI and building your custom dashboard.
Analyse traffic for specific campaigns
The most accurate way to track traffic coming to your website is by adding UTM values to your links. When used correctly, UTM values show you:
- Source - Where the traffic is coming from; e.g. Instagram, Facebook, X (Twitter).
- Medium - How the traffic is coming to your website; e.g. social media, email.
- Campaign - Why the traffic is coming to your website; e.g. the 'Product Launch Promo' campaign.
Pay attention to conversion rates
The best way to prove your ROI in Google Analytics is to use Goals and Conversions. You can create goals to track different leads such as newsletter subscribers, contact form submissions, content downloads, product trial signups, and, ultimately, new customers.
This way, you can learn much more about the anonymous traffic on your website to further optimise it.
How can Sendible help you with social media analytics and reporting?
So far, you've seen metrics and insights from the different social media networks' native platforms and Google Analytics.
These data sources are all valid and useful when reporting on your successes.
But what if there was a way to combine the best of these sources in one place?
That's one of the benefits of using Sendible's reporting suite.
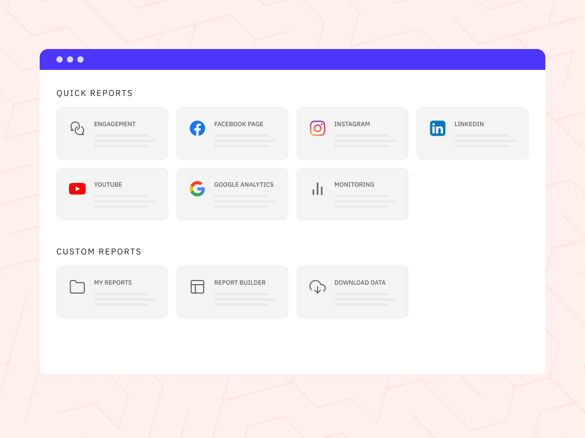
Reports Hub
The Reports Hub is available on all plans and gives you nine ready-to-go social media reports for an instant snapshot of your social data that will help you better understand your campaign performance.
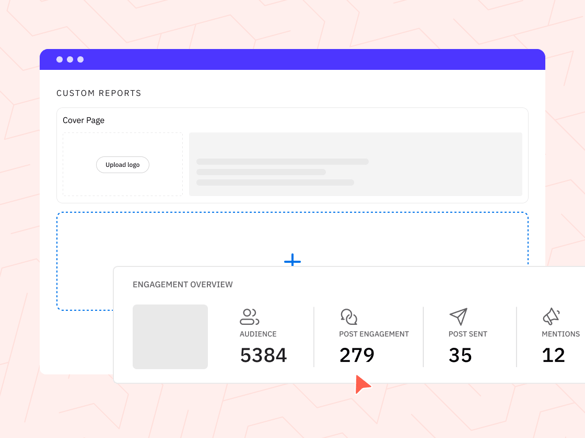
The area includes one overall 'Engagement' report that provides insights into your combined audience, post engagements, posts, and mentions across all the channels you manage.
These metrics are key when performing social listening for your brand.
Custom reports
You can take advantage of our Custom Reports feature to create reports that showcase your brand and demonstrate ROI through over 100 modules. Our drag-and-drop report builder makes it easy to tailor your reports to each client and provide them with valuable insights.
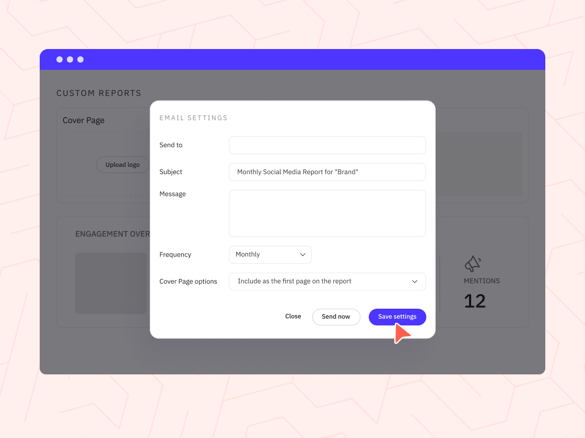
Automated reports
Make reporting on success a breeze for your clients by automating reports to be sent to key stakeholders, team members, and clients on a daily, weekly, or monthly basis. This saves time and ensures everyone is up-to-date with the latest insights.
Website traffic reporting with Google Analytics
Our Google Analytics report can help you understand how your social media content is affecting website visits. By identifying which social channels are driving the most traffic, you can focus your efforts on the most effective strategy.
FAQs about social media data and reporting
What’s the best way to prove social media ROI?
Use UTM tracking, Google Analytics goals, and conversion data from platforms like Sendible to measure actions like leads, sales, and downloads.
What KPIs should I track on social media?
Engagement rate, reach, click-through rate (CTR), conversions, cost-per-acquisition (CPA), and brand sentiment.
How often should I report on social media data?
Weekly or monthly is best for most teams. Sendible lets you automate reports on a schedule.

Try Sendible free with 14-day free trial.
Leverage Sendible’s extensive integrations to create, schedule, publish, and engage with your posts seamlessly.

Text copied!