The 2026 trend report

2026 social media trends: what 12 million posts tell us

We analysed 12.2 million posts scheduled through Sendible in 2025: where brands and agencies post, which formats they choose and when. The full report is below.

Get the 2027 edition first

Add your email to get the 2027 report before anyone else, plus this report as a PDF.

You’ll also get occasional tips and updates from Sendible. Unsubscribe any time.

Put the data to work

Plan, schedule and report across every network, with unlimited users on every plan.

Get started for free Or schedule a demo
trend-report-2026-page-key-findings trend-report-2026-page-emerging-networks Cover of Sendible’s 2026 social media management trend report

Key findings

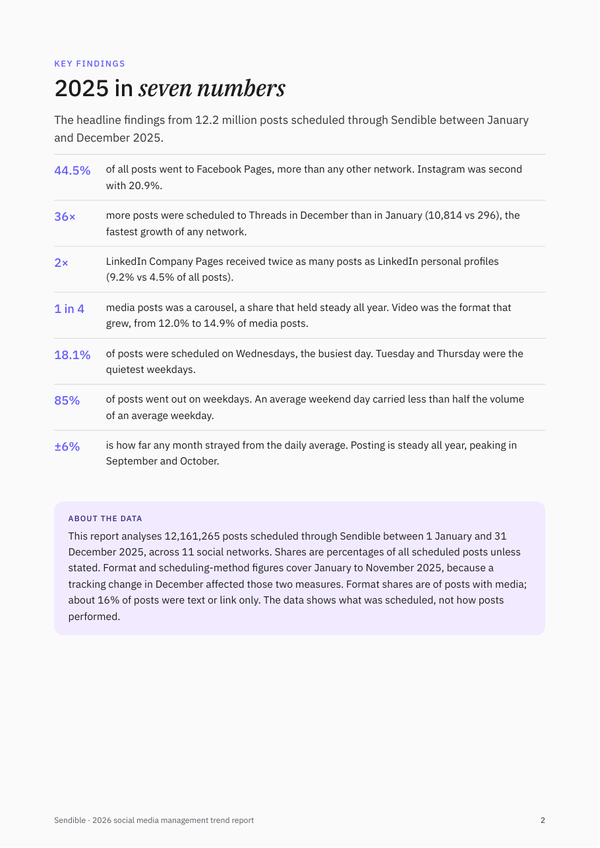
2025 in eight words.

12.2Mposts analysed, January to December 2025
44.5%of posts went to Facebook Pages
36×more Threads posts in December than January
2xas many posts to LinkedIn Pages as to personal profiles
1 in 4media posts was a carousel, all year
18.1%of posts went out on Wednesdays, the busiest day
85%of posts went out on weekdays
±6%the most any month strayed from the daily average

About the data: 12,161,265 posts scheduled through Sendible across 11 networks, January to December 2025. Format and scheduling-method figures cover January to November because of a tracking change in December. The data shows what was scheduled, not how posts performed.

2026 predictions

Three predictions for 2026

What the 2025 data says about the year ahead.

01

The growth is on the newer networks

Threads posting grew 36 times over 2025, while Facebook, Instagram and LinkedIn barely moved.

Your 2026 strategyKeep core networks steady and test one emerging network properly for a quarter.
02

LinkedIn Pages stay the B2B anchor

Brands scheduled twice as many posts to Company Pages as to personal profiles (9.2% vs 4.5% of all posts).

Your LinkedIn strategyUse your Page as the hub your team’s personal posts point back to.
03

Midweek is busiest, but there’s no single best day

Wednesday led overall, yet topped the week in only 5 of 12 months.

Your scheduling strategyTry Tuesday or Thursday for announcements, when feeds are quieter.

Channels

Where brands and agencies post

Facebook Pages carried 44.5% of all posts scheduled through Sendible in 2025. Facebook and Instagram together accounted for two in three.

Don’t ghost Facebook. Nearly half of everything scheduled still goes to Facebook Pages.
  • Facebook Pages44.5%
  • Instagram20.9%
  • X (Twitter)10.6%
  • LinkedIn Pages9.2%
  • Google Business7.5%
  • LinkedIn profiles4.5%
  • TikTok1.0%
  • YouTube0.6%
  • Threads0.6%
  • Bluesky0.3%

Share of 12.2 million posts scheduled through Sendible by network, January to December 2025.

Emerging networks

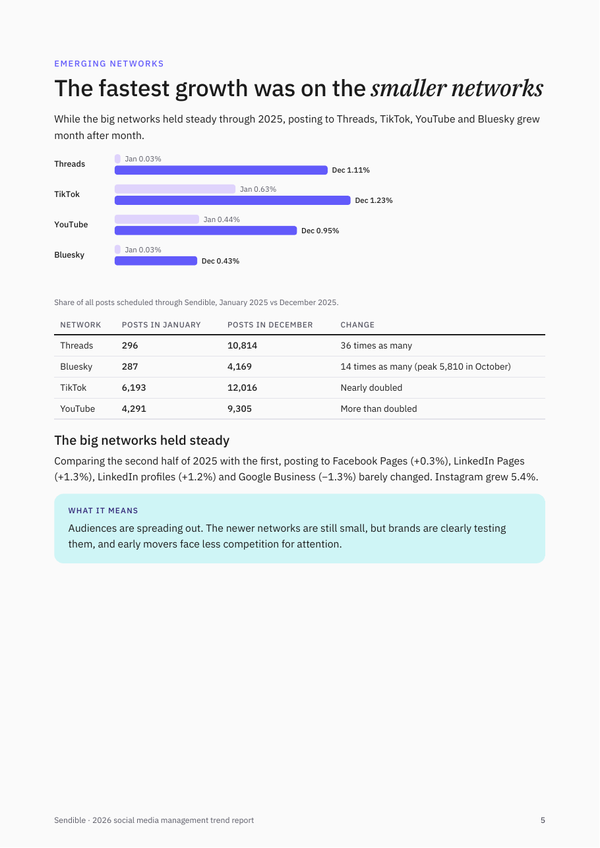
The fastest growth was on the smaller networks.

While the big networks held steady, posting to Threads, TikTok, YouTube and Bluesky grew month after month.

The big networks held steady. Second half vs first half of 2025: Facebook +0.3%, LinkedIn Pages +1.3%, Google Business −1.3%, Instagram +5.4%.
NetworkShare of posts, JanuaryShare of posts, DecemberGrowth in posts
Threads0.03%1.1%36×
Bluesky0.03%0.4%14× (peaked in October)
TikTok0.6%1.2%Nearly 2×
YouTube0.4%1.0%More than 2×

Posts scheduled through Sendible, January vs December 2025.

Post types

Carousels hold steady. Video is growing.

Images are still the backbone of most feeds, and carousels made up a steady quarter of media posts all year. Video was the format on the rise.

Video’s share grew through the year, from 12.0% of media posts in January to 14.9% in November. Stories grew 75%; Reels fell 35%.
  • Image59.7%
  • Carousel24.8%
  • Video13.0%
  • Stories1.8%
  • Reels0.8%

Share of posts with media by format, January to November 2025.

The efficiency engine

Most posts are crafted one by one.

94.9% of posts were created individually in the Compose Box. The Bulk Importer’s 5.1% share was remarkably consistent: 4.7–5.5% every month.

Your 2026 strategy. Bulk-import your evergreen baseline and let Smart Queues run it, so your team’s time goes into posts that can’t be automated.
  • Compose Box94.9%
  • Bulk Importer5.1%

Share of posts by creation method, January to November 2025.

“We have literally saved about 50% of our time previously spent on social media management by using Sendible.”
Scott Cox, Founder, Social Reach

The weekly heartbeat

What’s the best day to post?

Midweek is busiest, but no single day dominates. Wednesday carried 18.1% of posts in 2025, with Friday (17.4%) and Monday (17.3%) close behind. Tuesday and Thursday were the quietest weekdays, and 85% of posts went out Monday to Friday.

  • 17.3%Mon
  • 16.1%Tue
  • 18.1%Wed
  • 16.0%Thu
  • 17.4%Fri
  • 7.9%Sat
  • 7.2%Sun

Share of posts scheduled by day of the week, January to December 2025.

Seasonality

Posting is steady all year.

Measured per day, every month stayed within about 6% of the daily average of 33,300 posts. There’s no real off-season.

How to use it. Busiest: September and October (about 35,000 a day). Quietest: December and January (about 31,500). Start end-of-year storytelling in November.
  • Jan−5.1%
  • Feb−1.5%
  • Mar−1.8%
  • Apr+2.2%
  • May+2.1%
  • Jun+0.5%
  • Jul+1.9%
  • Aug−2.4%
  • Sep+5.1%
  • Oct+5.0%
  • Nov−0.6%
  • Dec−5.4%

Posts scheduled per day by month, compared with the 2025 average day.

In their words

What teams say about Sendible

“We have been able to grow our digital marketing agency because of how easy the program is to use.”
Meredith K, Social Media Manager (Capterra)
“It has the features I need to manage multiple accounts for multiple clients.”
Whitney R., Founder and Creative Director (G2)
“The account management and responsiveness of the customer support team have been excellent.”
Karen S., Social Media and Content Manager (G2)

Quotes are taken verbatim from published reviews on G2 and Capterra.

Get the 2027 edition first

Add your email to get the 2027 report before anyone else, plus this report as a PDF.

You’ll also get occasional tips and updates from Sendible. Unsubscribe any time.