
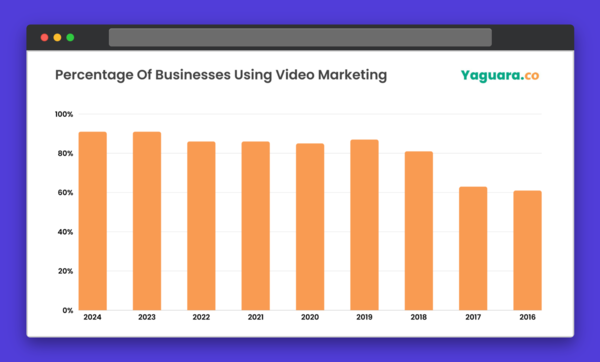
Video marketing is a big deal. In 2016, 61% of businesses were using video marketing. In 2023 and 2024, that number grew to an astounding 91%.
If you’re reading this, I’m willing to bet you’re part of that 91%. You just have one question: how do I know I’m on the right track?
Here’s where video metrics come in.
In this post, we’ll dive into what video metrics are, how they work on each platform, and which ones you should be tracking.
What are video metrics?
Video metrics are the numbers that tell you how your videos are performing on social media. They help you understand who’s watching, how they’re engaging, and whether your content is hitting the mark.
And most importantly, they reveal how your audience engages with your content.
Are people watching the whole thing or clicking away after five seconds? Are they liking, sharing, commenting, or just scrolling past? These are the kinds of questions video metrics help answer.
Compared to text or image posts, video content typically drives higher engagement. That’s because videos are dynamic, attention-grabbing, and often more emotionally impactful.
But with that power comes a need to track performance more closely. A catchy caption or polished graphic might get some likes, but a video opens the door to deeper interaction. Like longer watch times, shares, saves, and even direct conversions.
Key video metrics to track
12 Best TikTok Video Editors to Create Eye-Catching Content (2025)
There are numerous video metrics available, but a few stand out when it comes to truly understanding performance. Here are the key ones you’ll want to keep an eye on:
- View count vs. reach. View count tells you how many times your video was watched. This means even if it’s the same person watching more than once. Reach refers to the total number of unique users who viewed your video. A high view count with low reach might suggest repeat views, whereas a high reach with low views could point to content that isn’t compelling enough to watch.
- Video views. This is often one of the first numbers people look at. It shows how many times your video was played. However, be aware that what constitutes a “view” can vary by platform. For example, on Instagram and Facebook, it’s usually counted after 3 seconds, while on YouTube, it’s around 30 seconds.
- Retention rate. This indicates how long viewers are staying. A strong retention rate indicates that a significant portion of your video is being watched. A sudden drop-off early on? That might mean your intro needs work.
- Watch time and average view duration. Watch time refers to the total number of minutes (or hours) that your video has been watched. Average view duration shows how long people typically watch before clicking away. These metrics help you understand how well your content holds attention, and longer watch times can also boost your visibility on many platforms.
- Completion rate. This metric tells you the percentage of people who watched your video from start to finish. A high completion rate is a strong indication that your content is the right length, well-paced, and valuable to your audience.
- Click-through rate (CTR) and engagement. CTR measures the number of people who clicked on your call-to-action (such as “Learn more” or a product link) after watching the video. Engagement includes likes, comments, shares, and saves—basically, all the ways viewers interact with your video.
- Average Percentage Viewed (APV) measures how much of your video people actually watch, on average. It’s expressed as a percentage and helps you understand how engaging your content is from start to finish. A high APV means viewers are staying until the end, while a low APV may indicate drop-off early in the video.
- Average View Duration (AVD) shows how long, on average, viewers spend watching your video. It’s measured in seconds or minutes and helps you understand how well your content holds attention. A higher AVD suggests stronger viewer retention and more engaging content.
How video metrics differ by platform
Not all video metrics are created equal, and they definitely don’t work the same way across every platform. Each social media channel has its own method for counting views, measuring engagement, and prioritizing what matters most.
Here’s a quick breakdown of how video metrics differ by platform:
- YouTube. YouTube is built for long-form video, so its metrics go deep. It counts as a view after about 30 seconds of watch time, making it more reliable than platforms where views trigger almost instantly. You’ll also find detailed insights like audience retention, watch time, click-through rate, and impressions.
- Instagram. Instagram tracks video views after just 3 seconds. You'll also see statistics such as reach, plays, likes, comments, shares, and saves. For Stories and Reels, you can check metrics such as forward taps, replays, and exits. Reels also offer watch time and average watch percentage.
- TikTok. TikTok is all about quick, highly engaging content, and the metrics reflect that. A view is counted the moment the video starts playing. You’ll want to track average watch time, total play time, engagement rate, and completion rate. TikTok’s algorithm closely monitors how much of a video someone watches, as well as whether they rewatch, like, or share it. So retention and interaction are crucial here.
- Facebook. Similar to Instagram, Facebook counts a view after 3 seconds. You’ll get insights into video views, reach, engagement, average watch time, and audience retention. Facebook also shows thruplays, which is when someone watches at least 15 seconds or the full video, whichever comes first.
- LinkedIn. LinkedIn has a more business-focused audience, and its video metrics are relatively straightforward to understand. A view is counted when someone watches for at least 2 seconds with the video at 50% on screen. You can also see impressions, engagements (likes, comments, shares), and clicks if there’s a link attached.
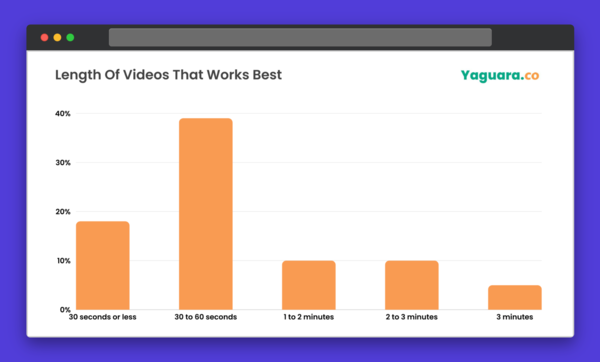
With the exception of YouTube, it’s pretty clear that shorter videos perform best. Regardless of the platform. When asked which video length performs best for them, the overwhelming response from marketers was 30 to 60 seconds.
How to use video metrics to improve performance
Tracking video metrics is only half the story. What you do with that data is what really counts. Here are a few innovative ways to utilize video metrics to level up your content.
1. Identify what content works
One of the most valuable things video metrics can show you is what your audience actually likes. By examining high-performing videos—especially those with strong completion rates, watch time, and engagement—you can begin to spot patterns.
Are shorter videos keeping people hooked? Do behind-the-scenes clips or how-to guides get more saves and shares? Use this data to guide your content planning and focus on the formats or topics that deliver results.
Also, don’t overlook the content that doesn’t perform well. If a video has low retention or gets skipped quickly, take a look at the intro. Maybe it’s not grabbing attention fast enough. This kind of honest review is key to improving over time.
2. A/B test and refine content
Testing different thumbnails, hooks, captions, or even video lengths can reveal what really clicks with your audience.
For example, you might try two versions of the same Reel—one that opens with a bold question and another that jumps straight into the action. Then, compare retention or engagement stats.
I also highly recommend using a more advanced reporting tool here. For example, Sendible’s reporting tool gives you in-depth analytics for all your content with just one click.
The goal here isn’t perfection right away. It’s continuous improvement. Over time, these small experiments help you refine everything from tone of voice to visual style.
3. Optimise for retention
Retention rate and average view duration are two key indicators of whether your video is keeping viewers engaged. If you’re seeing viewers drop off early, try tightening your editing by cutting out filler and adding stronger hooks in the first few seconds.
You can also experiment with pacing. On fast-moving platforms like TikTok or Reels, snappy cuts and dynamic visuals tend to capture attention more effectively.
For YouTube, especially with longer content, a clear narrative structure can go a long way toward keeping viewers watching until the end.
FAQ Section
What is a good video completion rate?
A good video completion rate typically falls between 50% and 70%, depending on the platform and video length. For shorter videos (under 30 seconds), aim for a completion rate of 70% or higher, while longer videos may perform well with a completion rate of around 50%.
How do I find video metrics on Instagram or TikTok?
You’ll need a professional or creator account to find video metrics on Instagram and TikTok. Here’s how:
On Instagram: Go to your profile → tap the video post → tap View Insights below the post. For Reels, you’ll see metrics like plays, reach, likes, comments, shares, saves, and watch time.
On TikTok: Go to your profile → tap the three lines (menu) → Creator tools → Analytics. You’ll find metrics for each video, including views, watch time, traffic source, audience retention, and engagement.
Which video metrics matter most for ROI?
The video metrics that matter most for ROI (return on investment) are click-through rate (CTR), conversion rate, watch time, retention, and engagement rate.
Conclusion
Video metrics aren’t just numbers. They’re insights that can help you create more impactful, engaging content. By understanding what works and why, you can refine your strategy, enhance performance, and convert views into tangible results. Start tracking, keep experimenting, and let the data guide your growth.
Try Sendible free with 14-day free trial.
Leverage Sendible’s extensive integrations to create, schedule, publish, and engage with your posts seamlessly.

Text copied!